t = torch.distributions.uniform.Uniform(0., 5.).sample((10,))
t = torch.sort(t)[0]
y = torch.randn_like(t)plot
Plotting functionality
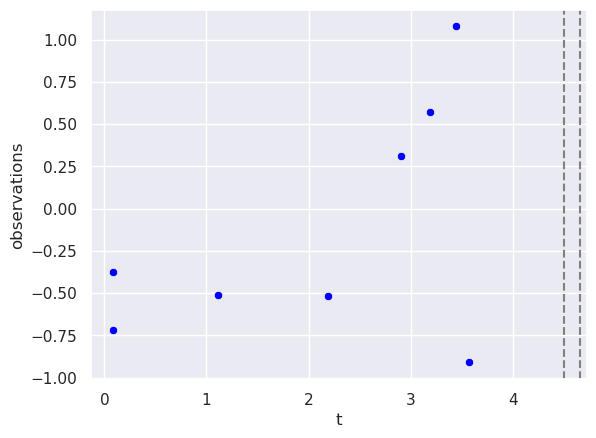
A function to make a scatterplot, along with some marks along the horizontal axis.
partially_observed_time_series
 partially_observed_time_series (observed_t:torch.Tensor,
                                 observed_y:torch.Tensor,
                                 to_predict_at_t:torch.Tensor)
Some test data
partially_observed_time_series(t[:8], y[:8], t[8:]);